



What decides whether a company is ready to enter a new market? The FISHE Capital™ framework answers: five capitals, read for one target market at a time, and the weakest of them sets the ceiling. Support helps only when it lifts that weakest capital. This article explains the idea, what it does and does not claim, and how to use it.
By Kasper-Tanakrit Sermsuksan, Founder, SEA Bridge · 21 November 2026 · about 9 minutes
Status. FISHE Capital is a proposed framework. Its propositions are stated for testing and have not yet been tested empirically. The formal statement is a SEA Bridge working paper (Sermsuksan, 2026). The examples below are illustrative, not client data.
The short answer
- A venture draws on five capitals to innovate and expand abroad: Financial, Intellectual, Social, Human and (Operating) Environment.
- Each capital is Assets × Capability: what you hold or can reach, times your repeatable ability to use it.
- Environment Capital belongs to a home-to-host market pair, so the same firm can be strong for one market and weak for another.
- Expressed as the outcome each permits in a market, the capitals are assumed not to substitute for each other: the weakest sets the ceiling.
- So, the framework proposes, a support program (a grant, a trade mission, training) is additional only when it raises the capital that binds, and a program that supplies one capital helps only up to the next-lowest one.
Why this question matters
Governments spend heavily to help small firms innovate and export, yet average effects are modest. A meta-analysis of 1,869 estimates from 37 firm-level studies of export promotion finds what its author calls "a small practical impact" (Demena, 2021). A meta-regression of 52 studies of R&D subsidies finds no crowding out but "no evidence of substantial additionality" (Dimos & Pugh, 2016).
Averages hide very different responses. Early-stage R&D grants in the United States roughly doubled recipients' chance of raising venture capital, more so for financially constrained firms (Howell, 2017). At Start-Up Chile, cash and coworking space alone had no measurable effect, whereas entrepreneurship schooling did (Gonzalez-Uribe & Leatherbee, 2018). Whether support works seems to depend on what it supplies, and to whom.
Thailand makes the question concrete. In 2024, about 1.1 percent of Thailand's 3.27 million enterprises, most of them micro or unincorporated, exported directly (Office of SMEs Promotion [OSMEP], 2025), while the country scores 5.52 out of 6 on access to markets and internationalization in the 2024 ASEAN SME Policy Index, an index of policy design rather than outcomes (OECD & ERIA, 2024). Firm size, productivity and the sunk cost of entering export markets are the leading explanations (Melitz, 2003; Bernard & Jensen, 1999; Roberts & Tybout, 1997). FISHE Capital adds one more candidate explanation: support may be well designed and still miss the constraint that binds each firm.
The five capitals
- F · Financial. Assets: Cash, credit lines, revenue. Capability: Fund, deploy and sustain entry spending under real market conditions.
- I · Intellectual. Assets: Documented market knowledge, processes and playbooks, IP. Capability: Turn knowledge into decisions that hold up in this market, beyond any one person.
- S · Social. Assets: Relationships, partners, reputation. Capability: Move through the market on trust and legitimacy, not just introductions.
- H · Human. Assets: People's skills, experience and tacit know-how; time and attention. Capability: Recruit, keep, develop and deploy the right people for this market.
- E · (Operating) Environment. Assets: The host market's rules, trade ties and view of your home country. Capability: Operate within those conditions, again and again.
The idea of capital as Assets × Capability builds on the resource-based view (Barney, 1991), which separates resources from the capability to deploy them (Amit & Schoemaker, 1993; Makadok, 2001), on dynamic capabilities (Teece et al., 1997) and on how firms structure, bundle and leverage resources (Sirmon et al., 2007). The multiplication sign carries the point: assets without capability earn nothing, and capability without assets has nothing to work on. The multiplication is an assumption the paper states for testing.
Environment Capital is the new part. FISHE grew out of SEA Bridge's earlier FISH Capital model, which had four capitals. The fifth is the operating environment of the market you are entering: its regulations, trade agreements and how buyers there see your home country, together with your ability to work within them. Because it is defined for a home-to-host pair, it changes by target market and need not be symmetric: a Thai firm entering Sweden can face a very different environment from a Swedish firm entering Thailand.
The weakest capital sets the ceiling

This is the framework's central assumption. Once each capital is expressed as the outcome it permits in a market, a surplus in one does not make up for a shortfall in another. A large budget does not buy a distributor's trust overnight; a strong network cannot legally sell a product that fails the host country's food rules.
The assumption is a choice, not a finding. The paper places it at one end of a family of rules, from fully additive (full compensation) to the strict minimum (none), and states in advance how to tell them apart. It also shows, by simulation, a hard limit: with realistic scoring error, cross-sectional data scored by judgment cannot reliably tell these rules apart. The cleaner test is an experiment that varies the type of support among firms whose binding capital was scored in advance (Sermsuksan, 2026).
The framework also allows for growth. Entrepreneurs can convert and recombine capitals over time (Baker & Nelson, 2005; Pret et al., 2016), and relationships, for example, can help build knowledge (Nahapiet & Ghoshal, 1998). FISHE treats that as a strategy that takes time, not as an escape from the ceiling today.
One firm, two markets

In Viet Nam, the firm's products are known in the region and trade rules are favorable, so Environment Capital is high. Social Capital binds: the firm has no distributor there yet. A trade mission or distributor matching would help, but only for two levels, until Intellectual or Human Capital binds next.
In Sweden, compliance with EU food rules has not been verified, so Environment Capital is low, and it drags down other capitals with it: a Thai network carries little weight there, and compliance costs absorb budget. Social and Environment Capital tie at the bottom. A trade mission alone would add partners whose orders the firm could not yet legally fill. Regulatory help alone lifts the ceiling a little, because a better environment also raises effective Social Capital, but the firm's lack of partners soon binds again. The largest gain comes from regulatory help plus partner matching, together or in sequence.
Same firm, same resources, different support needed. That is the practical message of the framework.
When support adds value: headroom

The paper's central proposition is conditional additionality: support causes change the firm would not otherwise have made only to the extent that it raises the binding capital, and a single-capital program helps only up to the headroom.

Two consequences follow for anyone who runs or buys support:
- Diagnose before you prescribe. Targeting the binding capital beats spreading the same budget over everything when the diagnosis is accurate enough and the headroom is not small. In the simplest case the paper analyzes, targeting wins when the chance that the diagnosis is right exceeds the even-spread amount per capital (budget ÷ number of capitals) divided by the smaller of the budget and the headroom. With a budget of 2 levels, five capitals and headroom of 2, that means a diagnosis right more than 20 percent of the time (Figure 5).
- Bundle when you cannot diagnose. Bundling gains on targeting when diagnosis is poor or headroom is small relative to the budget. But a bundle must cover every capital that might bind: one that leaves out the binding capital gains nothing.

From one firm to a whole support system
Add up the diagnostics for many firms in a province, a country or ASEAN, and the same logic asks a new question of a support system: does the support supplied match the capitals that bind the firms it is meant for?
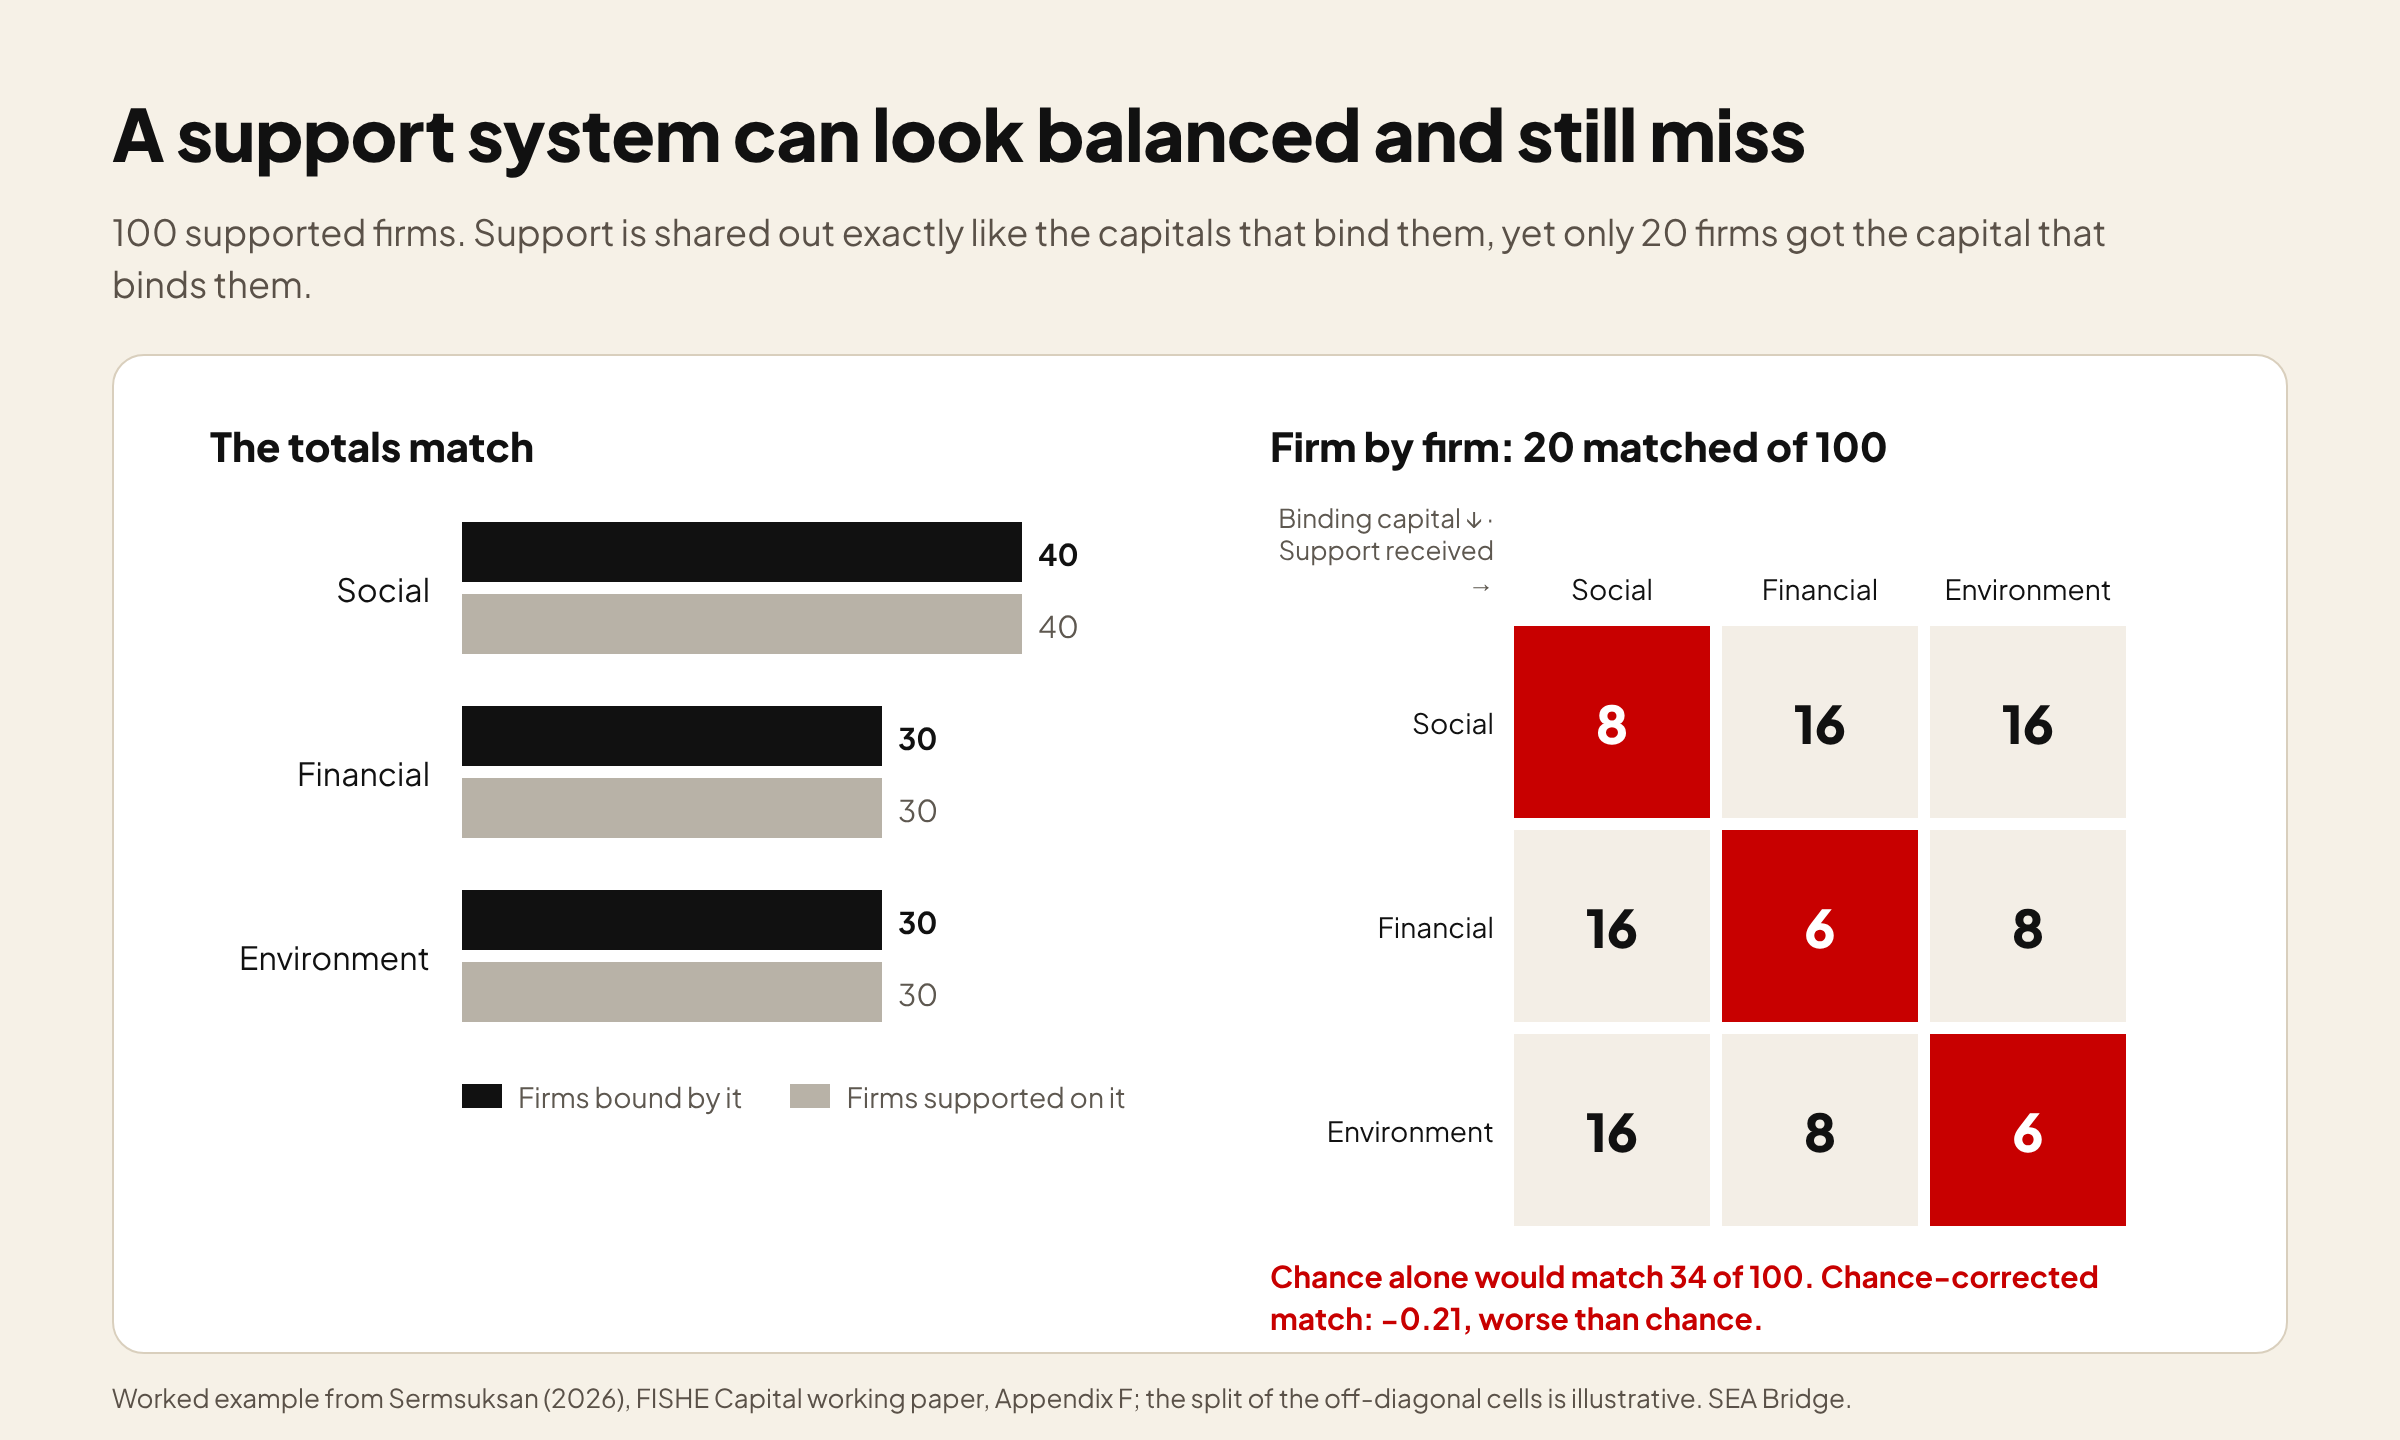
Policy indices score how support is designed (OECD & ERIA, 2024); ecosystem frameworks describe the conditions around firms. Neither asks this matching question. FISHE offers a measure for it, which can be computed once firm-level diagnostics exist for a representative sample.
How to use it today
- Pick one market. FISHE is always read for one target market. Viet Nam is not Indonesia.
- Score each capital on evidence, not intent. SEA Bridge uses the nine-level MX-RL™ scale, from 1 Unexplored to 9 Institutionalized, and in conservative mode the overall readiness level equals the lowest capital. Until scores are calibrated for a market, treat the result as a structured heuristic.
- Map it with FISHE × CSTO™. For each capital, list Challenges and Strengths inside your venture, and Threats and Opportunities in the target market.
- Find the binding capital and its headroom, then choose support that lifts it. Re-score after each step, because the binding capital can move.
The free Market Entry Readiness Check takes you through these steps for one market.

What FISHE Capital does not claim
- It is not yet tested. The propositions are stated for testing. The paper sets out how they could fail.
- It does not replace other explanations. Productivity, firm size and sunk entry costs still shape who exports (Melitz, 2003; Roberts & Tybout, 1997).
- It is not new multi-capital thinking. Livelihoods research, integrated reporting and community development all use several capitals. FISHE is an operational synthesis for firms that cross borders.
- It can leave people out. Firms that need several capitals at once can look like poor investments under a targeting rule. Results should be reported by firm segment, region and owner gender.
Frequently asked questions
Is FISHE Capital the same as SWOT? No. FISHE names the five capitals; CSTO is how SEA Bridge reads each one, with Challenges and Strengths inside the venture and Threats and Opportunities in the target market.
Why "(Operating) Environment" and not "Environmental"? Because it means the operating environment of the market you enter, not the natural environment.
Can a strong capital make up for a weak one? Over time, partly, by converting one into another. At a given moment, the framework assumes it cannot.
Where can I read the full argument? In the SEA Bridge working paper (Sermsuksan, 2026). The framework page, FISHE Capital™, summarizes it and links to the paper.
References
Amit, R., & Schoemaker, P. J. H. (1993). Strategic assets and organizational rent. Strategic Management Journal, 14(1), 33–46. doi.org/10.1002/smj.4250140105
Baker, T., & Nelson, R. E. (2005). Creating something from nothing: Resource construction through entrepreneurial bricolage. Administrative Science Quarterly, 50(3), 329–366. doi.org/10.2189/asqu.2005.50.3.329
Barney, J. (1991). Firm resources and sustained competitive advantage. Journal of Management, 17(1), 99–120. doi.org/10.1177/014920639101700108
Bernard, A. B., & Jensen, J. B. (1999). Exceptional exporter performance: Cause, effect, or both? Journal of International Economics, 47(1), 1–25. doi.org/10.1016/S0022-1996(98)00027-0
Demena, B. A. (2021). Effectiveness of export promotion programmes (ISS Working Paper No. 688). International Institute of Social Studies, Erasmus University Rotterdam. repub.eur.nl/pub/135711
Dimos, C., & Pugh, G. (2016). The effectiveness of R&D subsidies: A meta-regression analysis of the evaluation literature. Research Policy, 45(4), 797–815. doi.org/10.1016/j.respol.2016.01.002
Gonzalez-Uribe, J., & Leatherbee, M. (2018). The effects of business accelerators on venture performance: Evidence from Start-Up Chile. The Review of Financial Studies, 31(4), 1566–1603. doi.org/10.1093/rfs/hhx103
Howell, S. T. (2017). Financing innovation: Evidence from R&D grants. American Economic Review, 107(4), 1136–1164. doi.org/10.1257/aer.20150808
Makadok, R. (2001). Toward a synthesis of the resource-based and dynamic-capability views of rent creation. Strategic Management Journal, 22(5), 387–401. doi.org/10.1002/smj.158
Melitz, M. J. (2003). The impact of trade on intra-industry reallocations and aggregate industry productivity. Econometrica, 71(6), 1695–1725. doi.org/10.1111/1468-0262.00467
Nahapiet, J., & Ghoshal, S. (1998). Social capital, intellectual capital, and the organizational advantage. Academy of Management Review, 23(2), 242–266. doi.org/10.2307/259373
OECD & ERIA. (2024). SME policy index: ASEAN 2024. Enabling sustainable growth and digitalisation. OECD Publishing; Economic Research Institute for ASEAN and East Asia. www.eria.org/uploads/ASPI_2024-Full_report-upload-25Sep.pdf
Office of SMEs Promotion. (2025). รายงานสถานการณ์ SME ปี 2568 [SME situation report 2025]. OSMEP. bds.sme.go.th/Knowledge/Detail/21
Pret, T., Shaw, E., & Drakopoulou Dodd, S. (2016). Painting the full picture: The conversion of economic, cultural, social and symbolic capital. International Small Business Journal, 34(8), 1004–1027. doi.org/10.1177/0266242615595450
Roberts, M. J., & Tybout, J. R. (1997). The decision to export in Colombia: An empirical model of entry with sunk costs. American Economic Review, 87(4), 545–564.
Sermsuksan, K.-T. (2026). FISHE Capital: Weakest capital, uneven support. A firm-level diagnostic theory of additionality [Working paper]. SEA Bridge.
Sirmon, D. G., Hitt, M. A., & Ireland, R. D. (2007). Managing firm resources in dynamic environments to create value: Looking inside the black box. Academy of Management Review, 32(1), 273–292. doi.org/10.5465/amr.2007.23466005
Teece, D. J., Pisano, G., & Shuen, A. (1997). Dynamic capabilities and strategic management. Strategic Management Journal, 18(7), 509–533. doi.org/10.1002/(sici)1097-0266(199708)18:7<509::aid-smj882>3.0.co;2-z